Education: Master of Arts - Organizational Development:
Corporate Communications, Norwich
University, Oct 1997 Bachelor of Arts: English;Skidmore College, May 1995 Skills: Advanced Technical Writer; Software Tester; Journalist;
Photographer; Content Cultivator; Quality Assurance Analyst. Proficient with Capability
Maturity Model Integration (CMMI); Software Reviews; Agile Software Development;
System Development Life Cycle Development; Continuous Diagnostics
and Mitigation (CDM) - Her Nexx Chapter-Editorial
Project Director & Member Editorial Board; regularblog contributor
Top Secret (TS) / Eligible for Sensitive
Compartmentalized Information (SCI) Clearance
References available on request ~~~~*~~~~*~~~~*~~~~*~~~~*~~~~*~~~~*~~~~*~~~*~~~~*~~~~*~~~~*~~~~*~~~~*~~~~
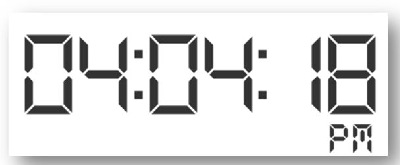
The use of a clock to explain or “tell” time has become one
of the most effective ways to determine the time of day or night. Two basic
clocks, digital and analog, generally appear on walls, watches, and a variety
of locations including on towers like Big Ben in London and along the walls of
the New York Stock Exchange.
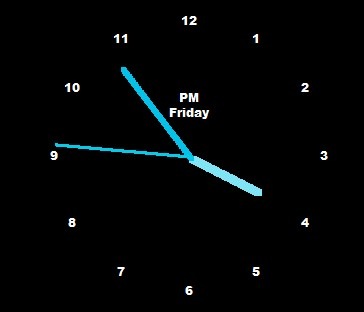
An analog clock generally uses a round or square format. The
12 hour clock uses the AM and PM format, although the AM and PM may not appear
on the clock itself.
Note: Analog clocks may display 24 hours instead of
12; the method for determining time is the same except the hours increase from
12 to 24 (see 24 Hour Analog Clock).
Note: The indicators that point to the numbers to
show hours and minutes are called hands.
An analog clock displays
numbers or markers from 1-12 to indicate 12 hours or one-half a day. It has at
least two hands that point at the numbers and the space between them to show
the time. Some clocks do not show all the numbers and some only have marks at
each hour, but the concept remains the same.
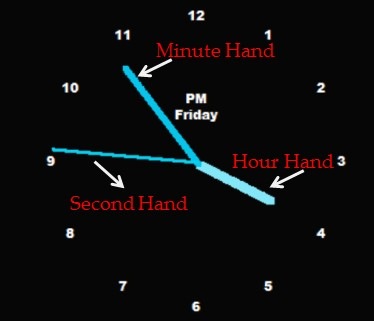
Note: The lengths of the hands indicate the
measurement. The shortest hand measures hours, the longer hand measures minutes
and, if there is a third hand, it is the longest and measures seconds.
The shortest or smallest hand
or indicator is the Hour Hand and this tells the person reading the clock the
hour. When it points to the 1, it is 1:00. When it points to the 8, it is 8:00.
When the hour hand points between two numbers, the time shows somewhat after
the first and before the next hour. The minute hand explains the exact time
between hours.
If there are two hands, the longest is the Minute Hand; if
there are three hands, the longest indicates the seconds within the minute and
the middle length hand shows the minutes within the hours. When it points to
the 12 or top of the clock, it is on the hour (for example, 1-o’clock).
Note: the longer the hand, the faster it moves and
the smaller segment of time it shows.
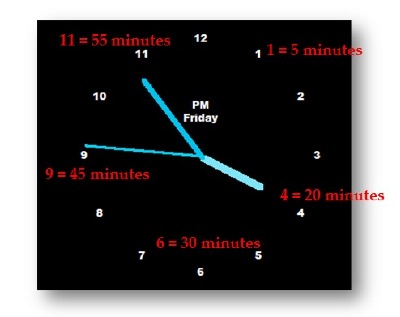
The minute hand shows the minutes and each of the numbers
indicated in 5 minute intervals. The number 1 equals 5 minutes, the number 2
equals 10 minutes, the number 3 equals 15 minutes, etc. The number 12 is 60
minutes and therefore a new hour.
The longest and third hand may not be included in all analog
clocks and that indicates the seconds. The format is the same as the minute
hand, but the time intervals are seconds. The same numbers apply so that 1
equals 5 seconds, 2 equals 10 seconds, etc.
The 24 hour analog clock shows numbers from 1 to 24 for all
the hours in one day. The hour hand points to the hour and the same concept
applies from digital clocks and therefore the hour hand pointing at 15 means
the time is 3:00 PM.
This clock below displays the time as 6:03 PM because the
hour hand points to 18 (6:00 p.m.) and the minute hand is 3 minutes past the
hour. The minute and second hand still only use 60 minutes/seconds. Often the
minutes and seconds appear on the face of the clock to assist with reading it
correctly.
A Brief Explanation of UML
Modeling (Otherwise known as “UML
Modeling for Dummies”)
The Unified Modeling Language
(UML) is a general-purpose visual modeling language that is used to specify,
visualize, construct, and document the artifacts of a system.
The most obvious part of UML is
its notation, an iconography for depicting the elements
of a system and their
interrelationships.
According to The Unified
Modeling Language Reference Manual (Rumbaugh, Jacobson, Booch 1999), a
model is a more or less complete abstraction of a system from a particular
viewpoint. It is complete in the sense
that it fully describes the system or entity, at the chosen level of precision
and viewpoint. A set of models may
capture different aspects of the same subject matter and the models can (to a
large extent, anyway) be manipulated separately.
A model may also include relevant parts of the system’s environment, represented, for example, by actors and
their interfaces. In particular, the
relationship of the environment to the system elements may be modeled. A system and its environment form a larger
system at a higher level of scope.
Therefore, it is possible to relate elements at various levels of detail
in a smooth way.
The Unified Modeling Language (UML) is a general-purpose
visual modeling language that is used to specify, visualize, construct, and
document the artifacts of a system. The
most obvious part of UML is its notation, an iconography for depicting the
elements of a system and their interrelationships. However, this graphic notation is just the
surface of UML, beneath which is a grammar that defines what is and is not
legal in UML. (Hence the term language,
rather than notation, in UML.)
UML offers many representations for capturing both dynamic
aspects (procedures, state-transitions, etc.) and static aspects (class
structure, class associations, etc.) of systems. Each of these representations generally
affords a modeler some flexibility in approach and style. Although this is good news for an individual
modeler, this flexibility can result in a babble of UML dialects and idioms
across a widely dispersed group of modelers.
In turn, this could lead to an inability to synthesize models from
different sources or even lead to mutual incomprehension among modelers.
TERMS
Activity
Diagram: An activity diagram depicts the flow of execution among individual
activities
Aggregation: An aggregation is a special form of
association that specifies a whole-part relationship
between
the aggregate (the whole) and the components (the parts).
Association: An association is the semantic
relationship between two or more classes that involves
connections among their instances
Attributes: An attribute is a named property of a
class that is used in the object description to hold
data
values for each object in that Class. A
list of attributes is an integral part of an object description.
Class: A class is a description of a group of
objects with similar properties and common behavior.
A
class represents a set of objects that have the same attributes,
operations, relationships, and semantics.
Class
Diagram: A class diagram shows the relationships between classes in the
system.
Composition: A Composition is a form of Aggregation
association with strong ownership and
consequent
lifetime of parts is dependent on the whole.
Dependency: Dependency is a semantic relationship
between two things in which a change in one
thing
(the independent thing) may affect the semantics of the other thing (the
dependent thing)
Event: An Event is the specification of a
significant occurrence that has a location in time and space.
In
the context of state machines, an Event is an occurrence of a stimulus
that can trigger a state transition.
Objects: An object is a thing, a concept or an
entity with well defined boundaries and meaning for the
application
under consideration.
Operation: An operation encapsulates behavior
that an object may carry out.
Sequence
Diagram: A sequence diagram depicts a time ordering of messages for some part
of a system
State: A state is condition or situation
during the life of an object during which it satisfies some
condition,
performs some activity, or waits for some events.
Statechart
Diagram: A statechart diagram provides a way to model the various states in
which an object can exist
and
the transitions among them.
Use
Case: A Use Case is a description of system behavior, in terms of sequences
of actions. A use case should
yield an observable result of value to an
actor. A use case contains all alternate flows of events related to producing
the
"observable result of value". More formally, a use case defines
a set of use-case instances or scenarios.
The
specification of a sequence of actions, including variants, that a system (or
other entity) can perform, interacting
with
actors of the system.
Use
Case Diagram: A Use Case Diagram shows the interaction between the use cases and
the actors.
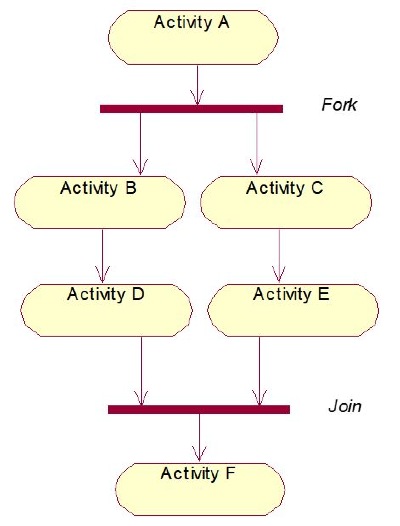
ACTIVITY DIAGRAMS
An activity diagram depicts the flow of execution
among individual activities. Although
the flow is often in a single linear sequence, more complex flows are possible.
These diagrams define where the flow starts, where it ends, what
activities occur during the workflow, and in what order the activities occur.
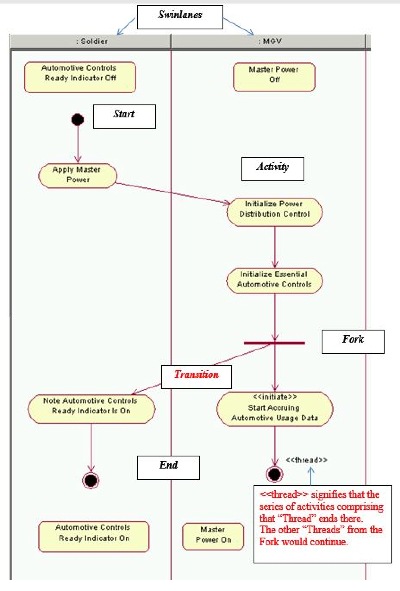
The solid lines represent transitions and illustrate how one activity leads to
another. The swimlanes represent a role
in the workflow. By looking at the transitions between activities in
different swimlanes, you can find out who needs to communicate with whom.
The flow may take one of several different paths
from a decision point based on the
value (true or false) of a guard condition.
Subsequently, the different paths will come back together at a merge point.
Another
possibility is that flow proceeds in multiple concurrent paths, as the result
of a fork. Later, these
concurrent paths will synchronize and recombine into a single path at a join.
-
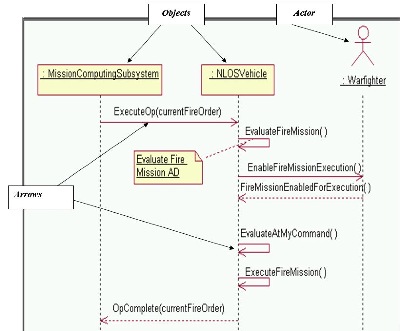
SEQUENCE DIAGRAMS
Sequence diagrams depict a time ordering of messages for
some part of a system. Specifically, a
sequence diagram depicts: synchronous and asynchronous messages; communication
latency; data passed and returned in messages; and constraints. Sequence diagrams also help to define and
depict subsystem responsibilities and the related subsystem interfaces.
Organize messages
in a general left-to-right order, with the use case’s initiating actor
positioned as the leftmost lifeline, and the use case’s initiating event being
the topmost message. All of the
objects depicted in the diagram should correspond with classes that have
already been defined. The initiating
actor should be placed on the left side, and the message flow should begin in
the top-left corner of the diagram.
Passive actors, which are ones that just react to the
system, should be placed on the right side of the diagram. Typically, moving from left to right, one
should see the initiating actor, system objects and other (passive) actors.
Objects are required by the system to perform. The arrows indicated the messages passed
between objects and object or object and actor.
-
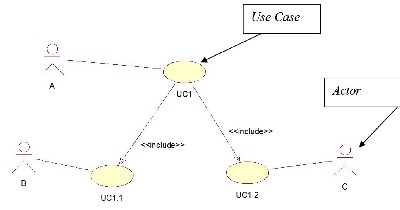
Use Case Diagram
The initiating actor or
actors are located to the left. Other
actors are outside the use case, never inside.
The arrows and <<includes>> (or, not shown here,
<<extends>>) indicated ancillary use cases. The actor represents anyone or anything that
is outsides the systems scope. The use
case is a high level piece of functionality that the system will provide
-
References: Boggs, Wendy and Boggs,
Michael. UML with Rationale Rose 2002. Alameda, CA: SYBEX, Inc, 2002.
Boeing: UML
Modeling Guidelines. D950-10677-1,
Rev B, 19 April 04.
Presentation: Foundation Technologies – Object-Oriented
Technology Concepts, by Dr. Arun K. Das.
Definitions:


 -
- -
- -
- -
-
 -
- -
- -
-